
August 27, 2024
This is the first article in a series of four data bulletins that analyze whether and how different variables affect pedestrian counts. Using data from DVRPC�’s cyclical pedestrian count program, planners looked at how college population and transit access may impact pedestrian activity in the City of Philadelphia. It was found that college population and transit activity density significantly influence pedestrian counts, confirming that stratifying census tracts based on these factors effectively captures variations in pedestrian activity levels.
Introduction
Delaware Valley Regional Planning Commission (DVRPC)’s Southeastern Pennsylvania Cyclical Pedestrian Counting Program collects and analyzes pedestrian volumes to track trends at 170 locations in Bucks, Chester, Delaware, Montgomery, and Philadelphia counties. The project team analyzed the pedestrian volume data collected using a stratified random sampling methodology, where count locations are divided into subgroups called strata. This analysis aims to uncover the effectiveness of stratifying count locations as a strategy to capture variations in pedestrian activity levels. Capturing relevant, valuable, and representative data is critical to inform planning policy decisions.
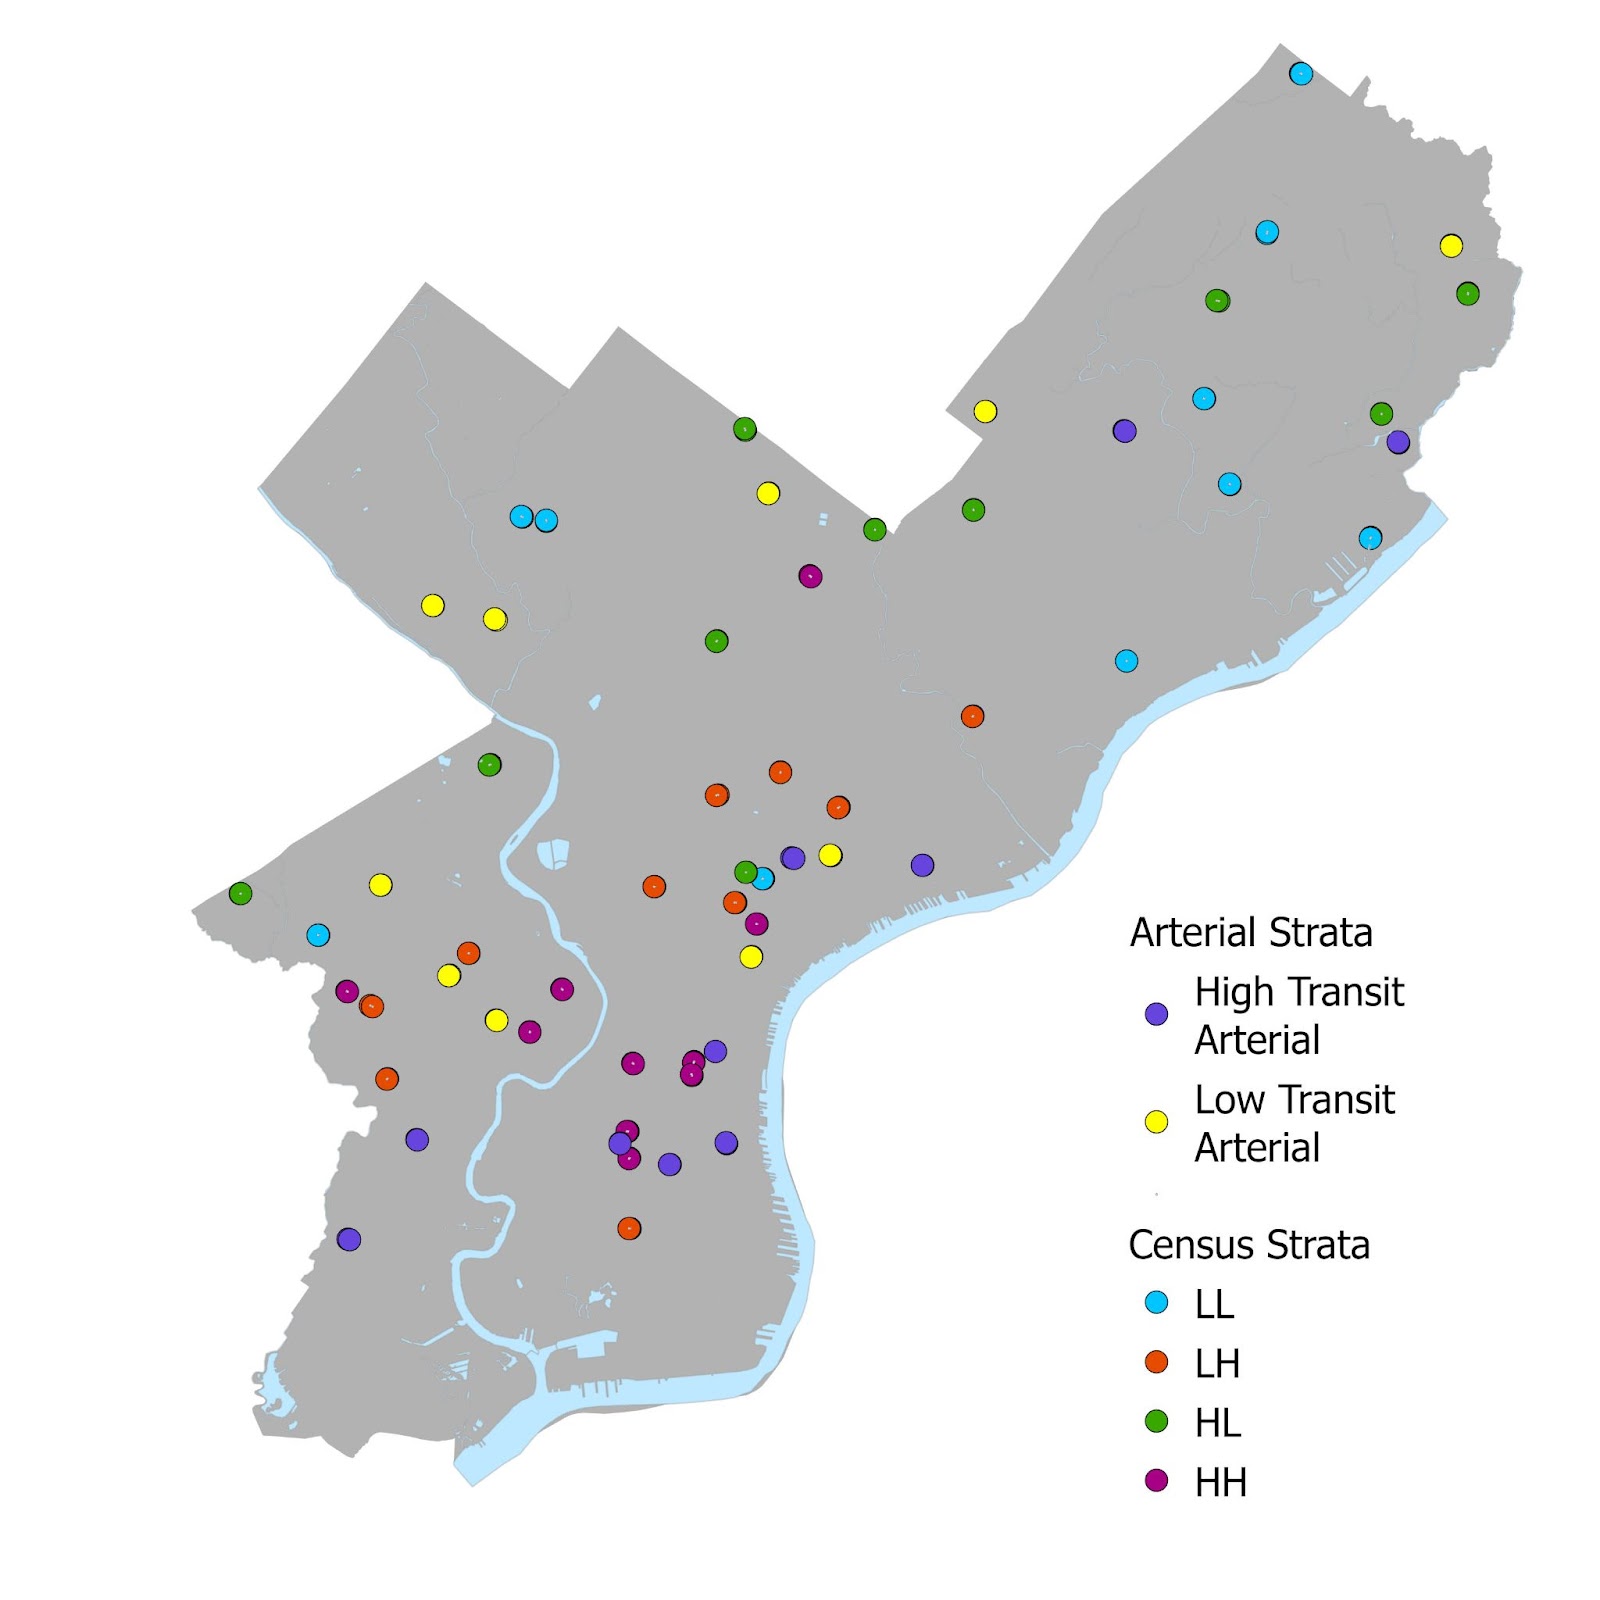
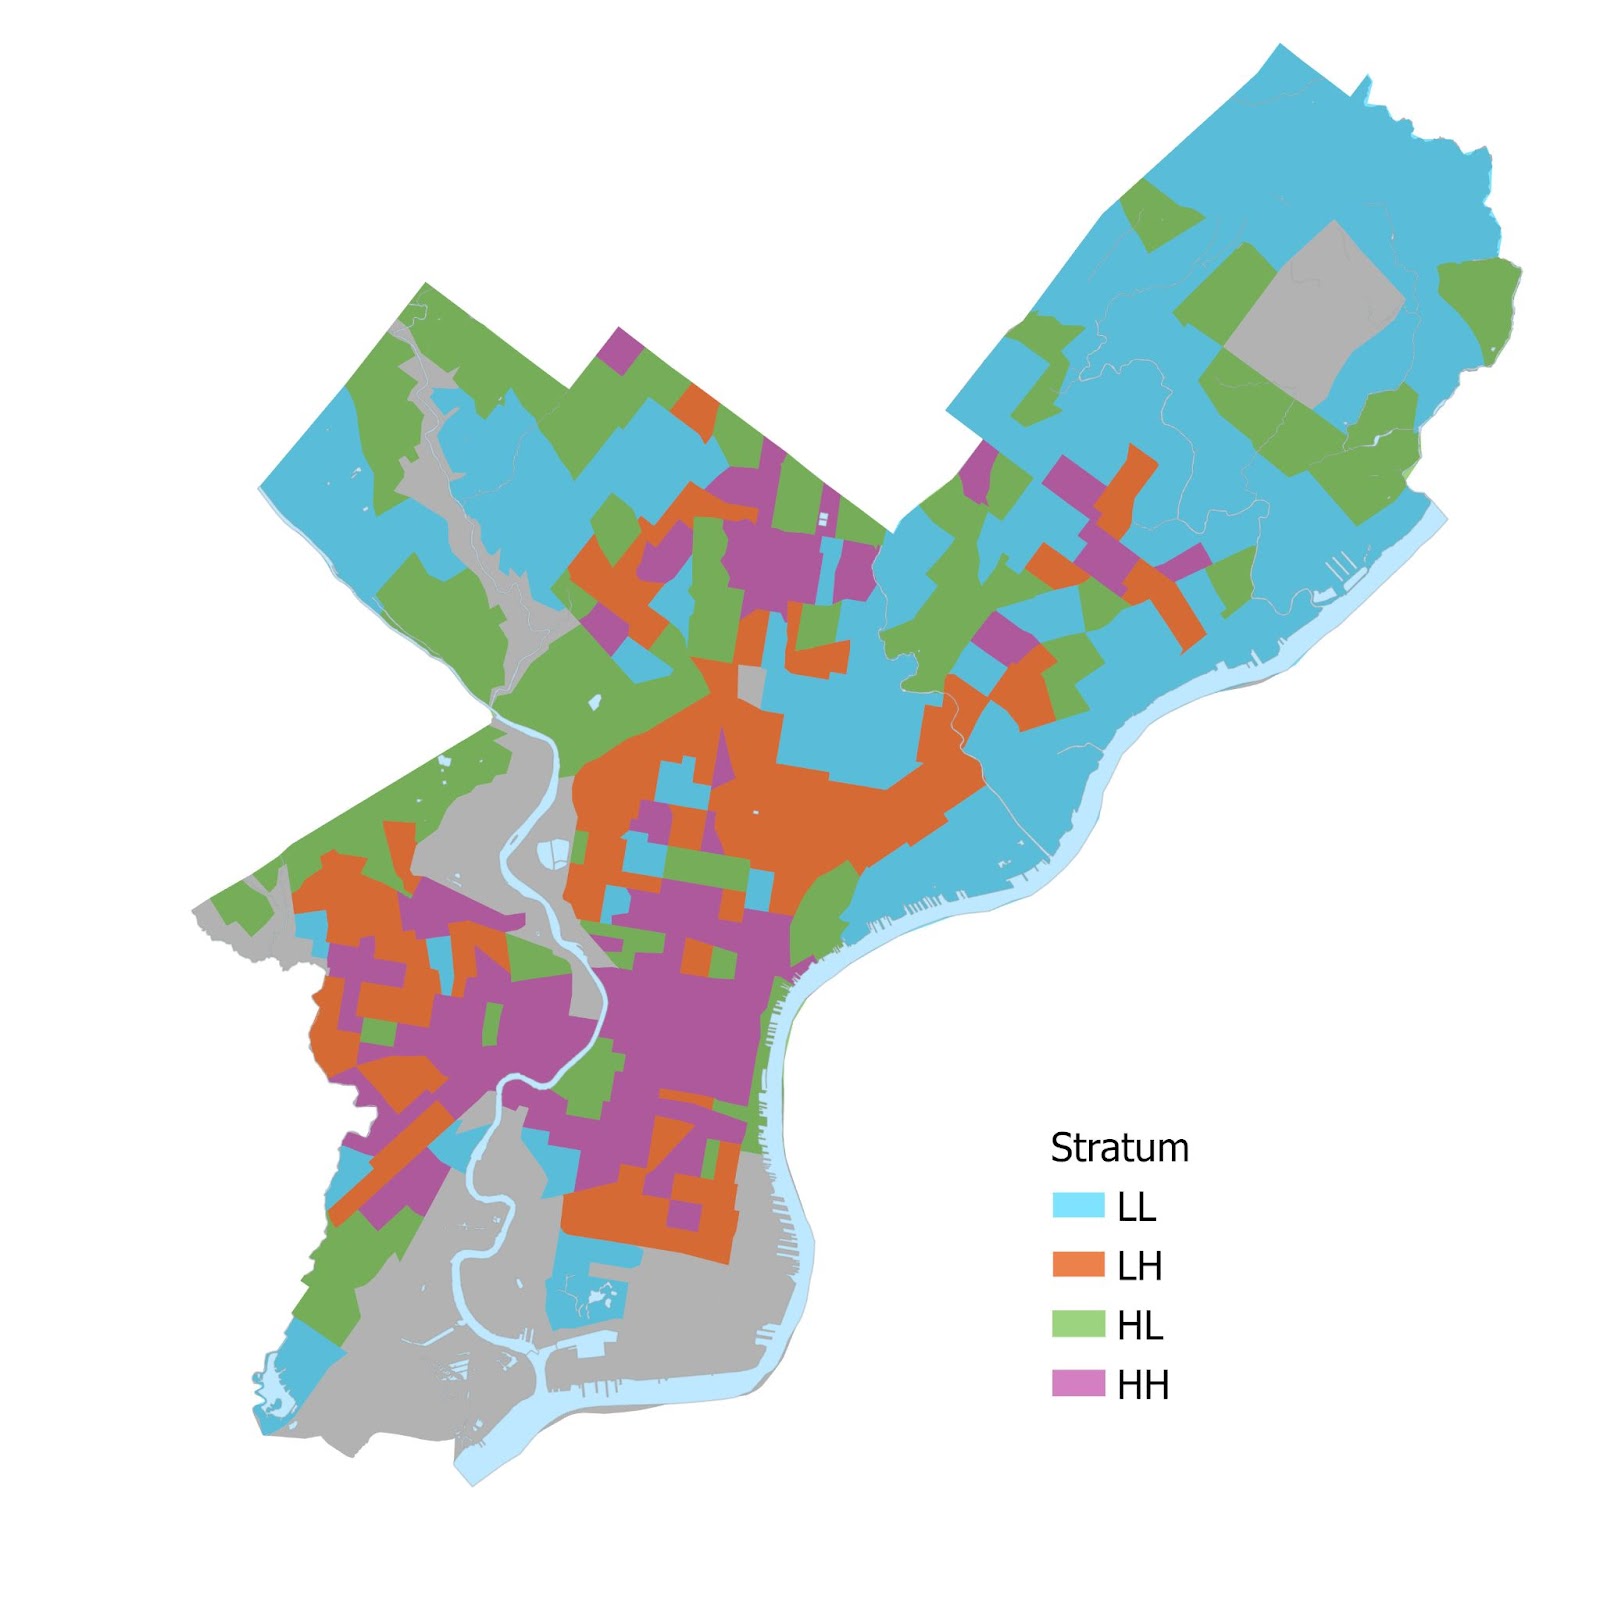
The project team established four types of strata: census tract, transit and non-transit arterials, high and low ridership transit streets, and schools. This study focuses on Philadelphia's census tract and arterial strata. Census tracts are categorized as either "high" or "low" based on the percentage of college students and the density of transit activity. Tracts with values above the median for the percentage of college students are classified as "high," while those below the median are classified as "low." This classification method is applied to each census tract based on the density of transit activity. The combination of these classifications results in four strata:
- HH (high percentage of college students and high transit activity)
- HL (high percentage of college students and low transit activity)
- LH (low percentage of college students and high transit activity)
- LL (low percentage of college students and low transit activity)
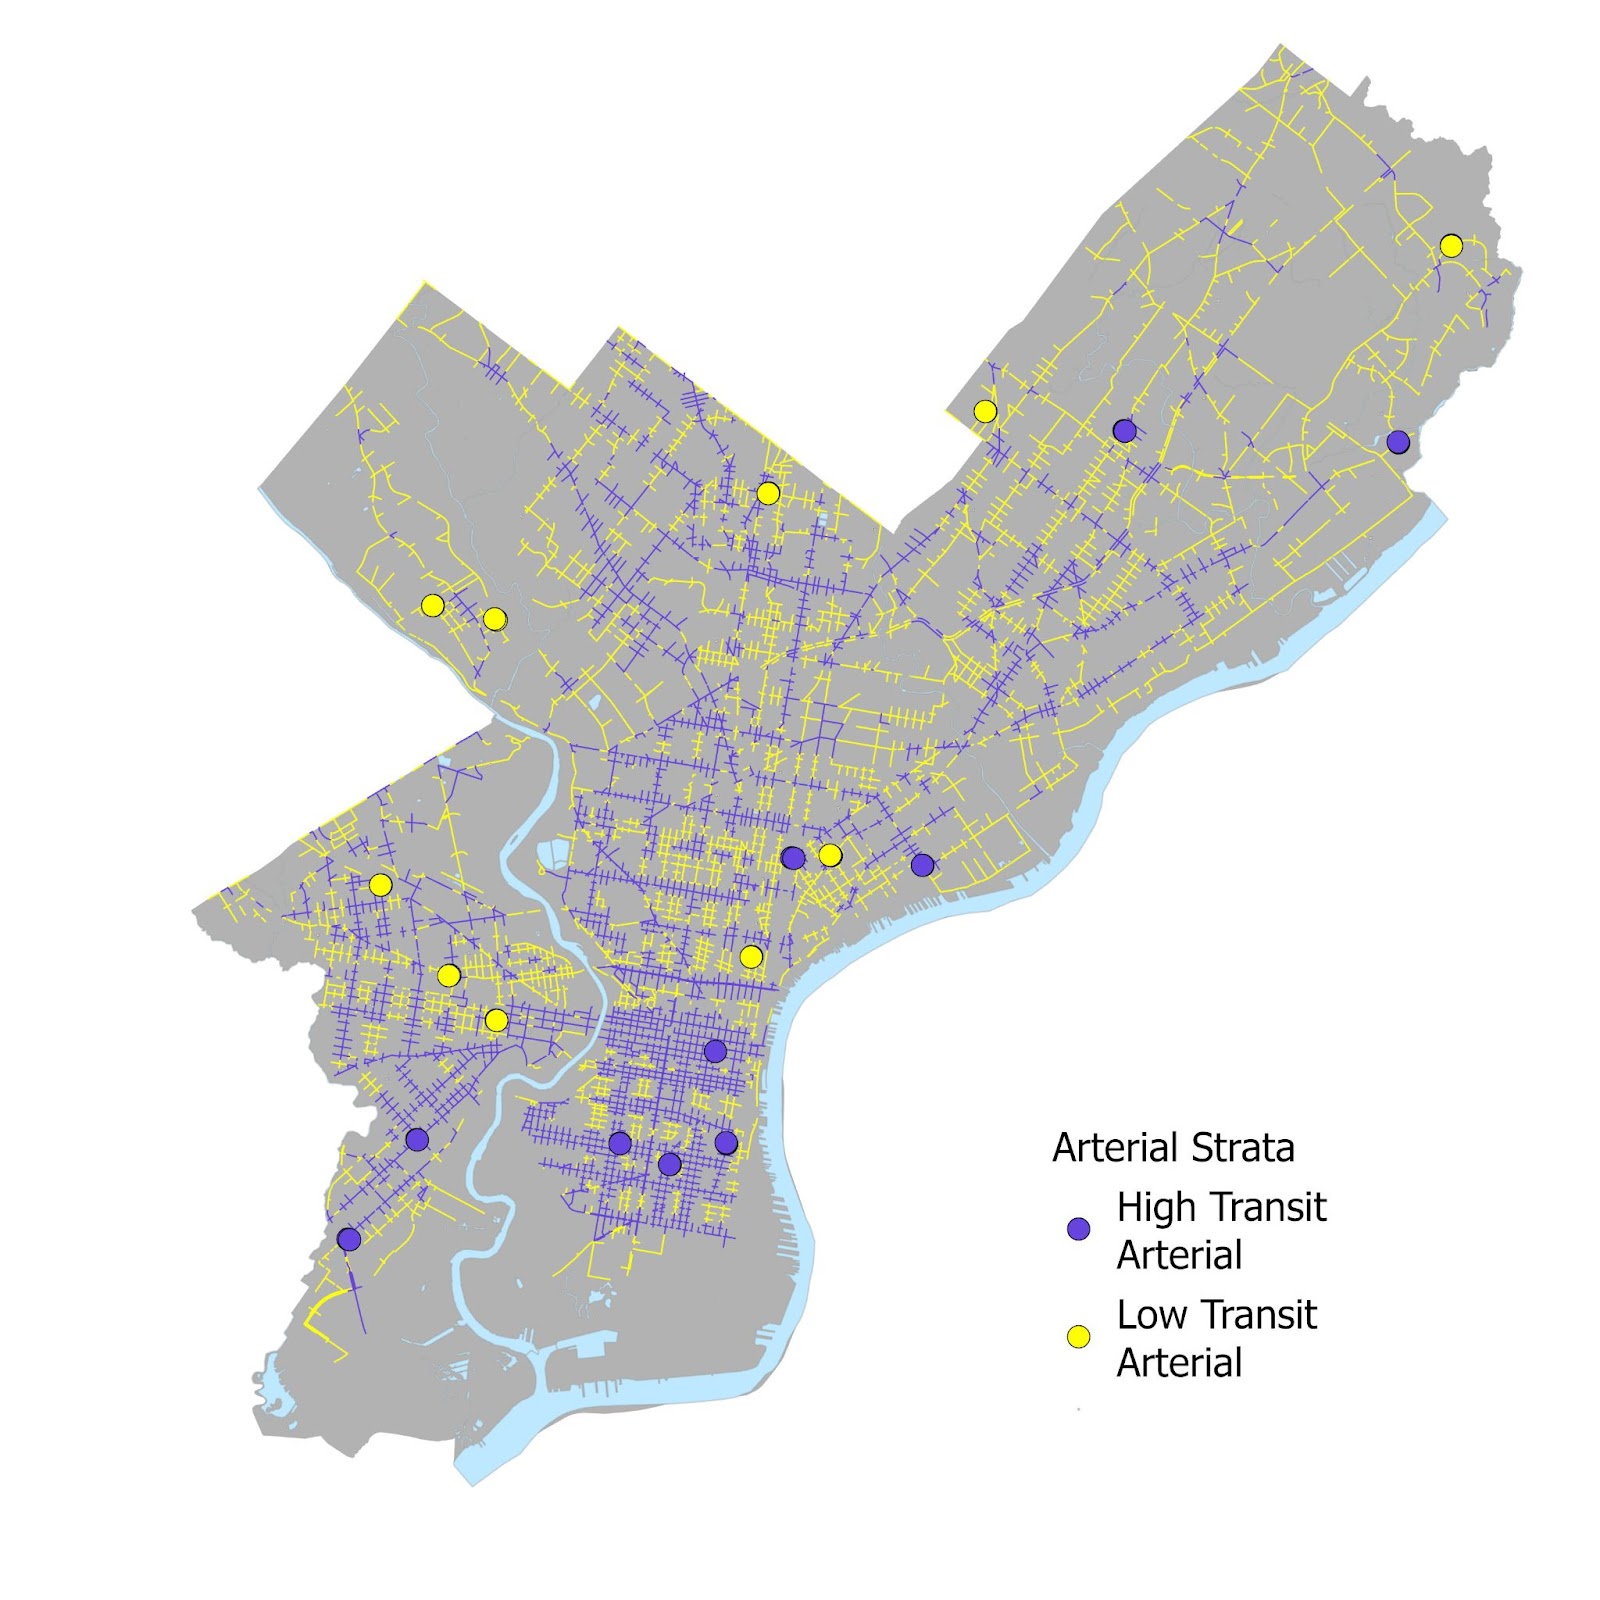
For arterial strata, the distinction is made between high- and low-ridership segments based on transit activity. Streets within 500 feet of a bus, trolley, or heavy rail stop are classified as "transit streets" and are eligible for consideration in this analysis.
Analysis Question:
Does categorizing census tracts and streets into strata, based on census tract characteristics and transit ridership on streets, yield a statistically significant relationship with the annual average daily pedestrian count (AADP) in Philadelphia?
Exploratory Analysis
Figure 4: Average Pedestrian Counts by Stratum in Philadelphia
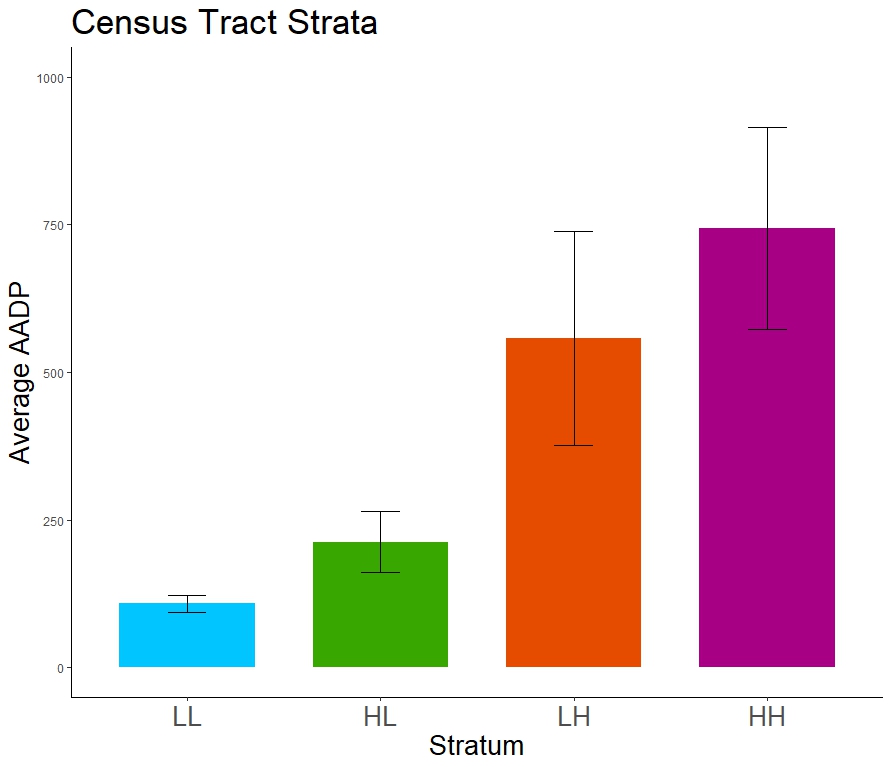
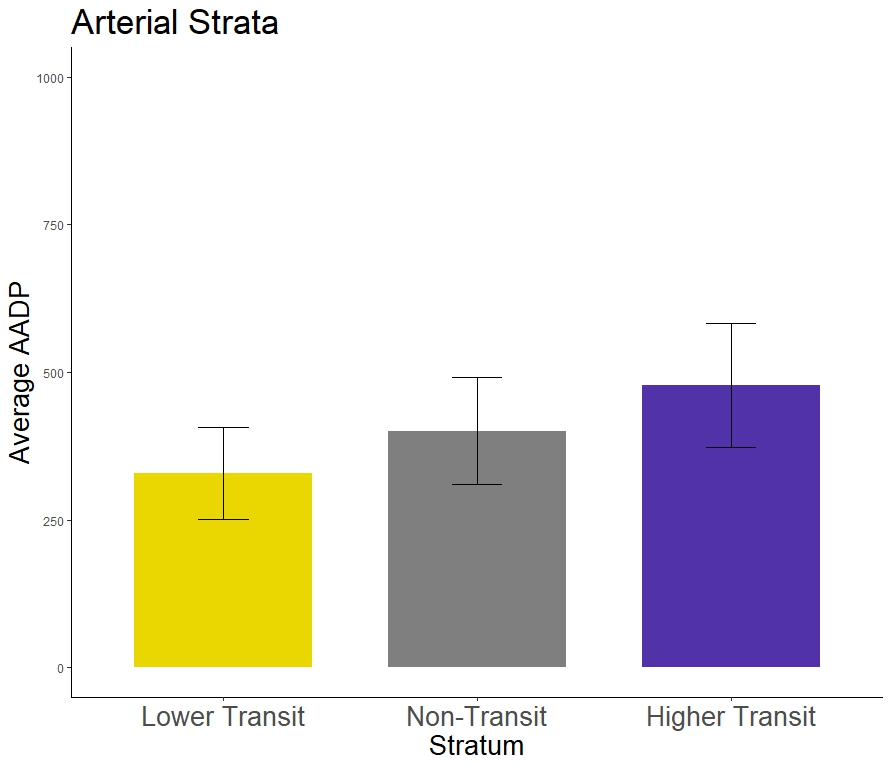
The bar plots above illustrate the average pedestrian count by strata for the census tract and arterial strata. The error bars shown in black represent the variability associated with the average pedestrian count for each stratum. These figures represent how pedestrian volumes differ across substrata.
Methods
The project team utilized a generalized linear model with a negative binomial distribution to address the non-normal distribution and overdispersion of AADP counts. This approach was well-suited for handling high variability pedestrian count data and helped ensure the accuracy and reliability of the analysis.
In the first regression model, we created binary variables by assigning a value of one to 'High' and a zero to 'Low' for each stratum variable, college population, and transit activity density. For example, count stations within stratum HH were assigned one for college population and one for transit activity density. In contrast, count stations within stratum LL were assigned a zero for college population and a zero for transit activity density. By utilizing binary variables to represent strata categorization, we are able to understand the effectiveness of stratification in understanding pedestrian activity.
In the second regression model, the variables used to create the strata are represented as numerical values. This allowed us to quantify the relationship between each stratum variable and the dependent variable, pedestrian counts.
In the third regression model, we adopted a similar approach to the first model, employing binary variables to represent strata categorization. Here, we assigned a value of one to observations within the "Higher Transit Streets" stratum and zero to those outside it. Likewise, we assigned a value of one to observations within the "Lower Transit Streets" stratum and zero to those not falling within it. This method assesses the effectiveness of stratification in capturing variance in pedestrian activity levels.
Stratum Analysis Results
When interpreting the results of our regression models, it is important to understand both the coefficients and the p-value. The regression coefficients indicate the direction and magnitude between each independent and dependent variable (AADP). A positive coefficient suggests an increase in AADP with an increase in the independent variable. In contrast, a negative coefficient indicates a decrease in AADP with an increase in the independent variable. The p-value helps determine the statistical significance of these relations. In the tables below, variables that are statistically significant are highlighted. A p-value less than 0.05 suggests that the effect of the variable is significant and unlikely to be due to random chance. In contrast, a p-value greater than 0.05 indicates the effect is insignificant.
Table 1: Regression 1 Results
| Binary Variable | Coefficient | P-Value |
|---|---|---|
| College Population | 0.48 | < 0.05 |
| Transit Activity Density | 1.44 | < 0.05 |
Using binary variables in Regression 1 allowed the project team to categorically assess the impact of strata variables on pedestrian activity, as shown in Table 1. The analysis indicates that census tracts categorized as high college population are associated with a pedestrian count that is 1.6 times higher, while those categorized as high transit activity density are associated with a pedestrian count that is 4.2 times higher.
Table 2: Regression 2 Results
| Numeric Variable | Coefficient | P-Value |
|---|---|---|
| College Population | 0.02 | < 0.05 |
| Transit Activity Density | 0.00004 | < 0.05 |
College Population and Transit Activity Density are positively and significantly correlated with pedestrian counts in Philadelphia when treated as both binary or numeric variables. The coefficients suggest that a one-unit increase in college population, the expected pedestrian count increases by a factor of approximately 1.0202, or by about 2%. Similarly, a one unit increase in transit activity density increases the pedestrian count by a factor of approximately 1.00004, or about 0.004%.
Arterial Analysis Results
Table 3: Regression 3 Results
| Binary Variable | Coefficient | P-Value |
|---|---|---|
| High Transit Arterial | 0.17 | > 0.05 |
| Low Transit Arterial | -0.19 | > 0.05 |
When treated as binary variables, high-transit arterials have a positive relationship with the pedestrian count and low-transit arterials have a negative relationship with the pedestrian count, but these relationships are not statistically significant, as indicated by the p-values in Table 3.
Discussion
In our stratum analysis, we found that both the college population and transit activity density significantly influence pedestrian counts in Philadelphia County, whether these factors are categorized into strata as binary variables or treated as numeric variables. These findings confirm that the stratification of census tracts based on college population and transit activity effectively captures significant variations in pedestrian activity levels.
In our arterial analysis, when treated as binary variables, higher transit streets show a positive relationship with pedestrian counts and lower transit streets show a negative relationship with pedestrian counts. However, this relationship is not statistically significant, as indicated by the p-values. This suggests that while there may be a relationship between the stratification of arterials based on transit activity and pedestrian activity, it is not strong enough to be considered statistically significant in this analysis.
The next data bulletin in this series will focus on the four suburban counties in Pennsylvania.