March 7, 2024
A new story map from DVRPC provides an overview of the Bicycle Cyclical Count Program and analyzes bicycle volumes from 2014 to 2022. Users can view the data by county and by individual count location.
Similar to how planners use vehicular traffic counts to analyze roadway facilities, DVRPC’s bicycle counts allow planners to measure existing levels of bicycling, monitor travel trends, plan for new or improved facilities, and measure outcomes of bicycle related projects. Launched in 2014, the Bicycle Cyclical Count Program collects and analyzes bicycle volumes at 134 locations in the nine-county DVRPC region. These locations were selected for their representative attributes, geographic diversity, and bicycle facility types. The data collected can help uncover trends in cycling behavior over time and inform conclusions about what might be causing these trends.
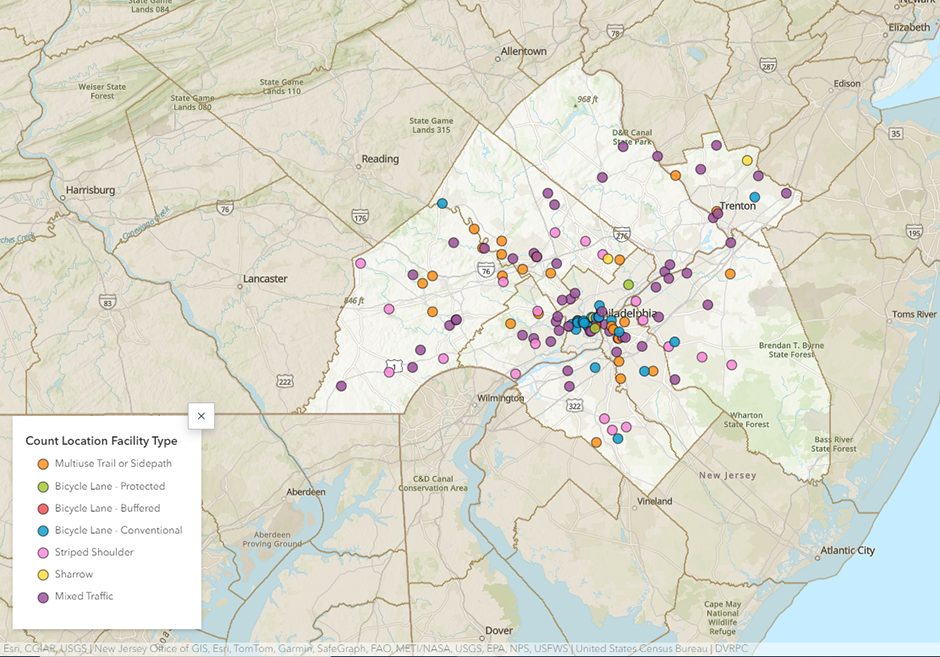
A new story map from DVRPC provides an overview of the Bicycle Cyclical Count Program and analyzes bicycle volumes from 2014 to 2022. Users can view the data by county and by individual count location. Planners, lawmakers, and the public can use this information to gain a better understanding of changes in bicycle volumes over time, across different geographies, and on different bicycle facility types; to inform policy decisions at the municipal and county levels; and to guide future bicycle infrastructure investments in the region.
It is important to acknowledge there are limitations with this program. The Bicycle Cyclical Count Program cannot collect data from every bicycle facility in the nine-county region, and there may be instances where newly installed bicycle infrastructure on a corridor that is not part of the program impacts bicycle volumes on a nearby street that is part of the program. However, as more counts are collected and the database grows over time, the program will reflect bicycle volumes and trends in the region more accurately, shining a light on the role bicyclists play in our transportation network. To learn more, view the Bicycle Cyclical Count Program story map.