May 15, 2024
Learn about DVRPC’s Permanent Bike and Cyclical Bike Count programs, which collect volume data to measure existing levels of bicycling, monitor and uncover travel trends, help inform new or improved bike facilities, and measure outcomes of bicycle-related projects.
May is National Bike Month, a month-long event promoted by the League of American Bicyclists to highlight the benefits of biking and encourage more people to give it a try. All year long, DVRPC supports bicycling planning and infrastructure to improve bicycle safety and connectivity throughout the nine-county region. One key effort is DVRPC’s Permanent Bike and Cyclical Bike Count programs, which collect volume data to measure existing levels of bicycling, monitor and uncover travel trends, help inform new or improved bike facilities, and measure outcomes of bicycle-related projects.
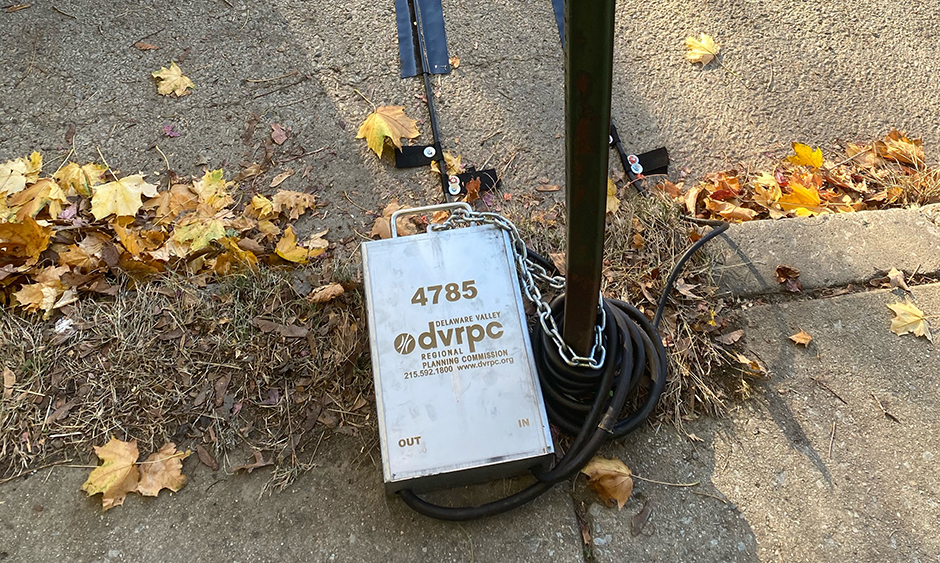
The Permanent Bike Count Program, supported by funding from the William Penn Foundation and the Pennsylvania Environmental Council, collects bicycle volume data with 16 counters placed along Circuit Trails across the region. These counters collect bicyclist and pedestrian activity 24 hours per day, 365 days per year, allowing DVRPC staff to identify trends in trail use and develop seasonal adjustment factors that can be applied to the short-duration bike counts.
The Cyclical Bike Count Program collects bicycle volumes for seven days at 150 locations across the nine-county region every three years. Of these locations, 90 are in Pennsylvania, and 60 are in New Jersey. The locations were selected with input from member governments and planning partners for their representative attributes, geographic diversity, and varied bicycle facility types. In March 2024, DVRPC published a story map that provides an overview of the Cyclical Bike Count Program and analyzes bicycle volumes from 2014 to 2022.
Bicycle count data plays an important role in planning for the region. Understanding how people bike in the region and how travel trends differ by location can inform planning for future projects that aim to improve bicycling. For more information about the counting program, previous news stories and products, and counting locations, visit the Bicycle and Pedestrian Counts web page.