May 24, 2023
DVRPC launched its Bicycle Cyclical Count Program in 2014. The program collects and analyzes bicycle volumes to track trends at 150 different locations in the nine-county region. These locations were selected for their representative attributes, like having different types of bicycle facilities, such as multi-use trails, dedicated bicycle lanes, striped shoulders, sharrows, and in mixed traffic.
The Delaware Valley Regional Planning Commission (DVRPC) launched its Bicycle Cyclical Count Program in 2014. Using the data collected over the last eight years, we can uncover trends in cycling behavior in Philadelphia and draw informed conclusions about what might be causing them.
DVRPC’s Bicycle Cyclical Count Program collects and analyzes bicycle volumes to track trends at 150 different locations in the nine-county region. These locations were selected for their representative attributes like having different types of bicycle facilities, such as multi-use trails, dedicated bicycle lanes, striped shoulders, sharrows, and in mixed traffic. DVRPC deploys the counters and collects data for seven days at each location every three years. The annual average daily bicycles (AADB) is then calculated each day by multiplying the raw count by the seasonal adjustment factor1 and equipment factor2.
Based on 35 locations, between 2017 to 2019, Philadelphia experienced a seven percent net increase in AADB compared to 2014 to 2016. The growth was made up entirely of cyclists using dedicated bicycle lanes, including protected, buffered, and conventional. However, after the start of the COVID-19 pandemic, bicycle ridership in the City plummeted, and between 2020 to 2022, it was down 35 percent. Philadelphia's three most heavily ridden neighborhoods, including Central, South, and University-Southwest, steadily increased in AADB before the pandemic but experienced a significant decline afterward.
Trends by Neighborhood:
To better understand geographic factors impacting bicycle trends in Philadelphia, ridership was evaluated by neighborhood. In Figure 1, South Philadelphia, one of the three highest bicycle volumes neighborhoods in Philadelphia, had the highest increase of cyclists in the years before the pandemic, growing by 32 percent. It was significantly higher than Central and University-Southwest, which increased by nine percent and eight percent, respectively. However, between 2020 to 2022, bicycle ridership in South Philadelphia dropped more than 53 percent. In Central and University Southwest, bicycle ridership fell by 34 percent and 29 percent, respectively. In all three neighborhoods, ridership from 2020 to 2022 was below the level measured from 2014 to 2016, the beginning of data collection.
Figure 1

Trends by Bicycle Facility Type:
To understand cyclists' preferences and uncover behavior patterns, bicycle volumes were analyzed by facility type. As seen in Table 1, only dedicated bicycle lanes saw an increase in ridership among the measured bicycle facility types in the years before COVID-19. Protected and buffered bicycle lanes grew by 31 percent and 33 percent, respectively, while conventional experienced only a five percent increase, demonstrating a clear preference by cyclists. From 2020 to 2022, the AADB on all seven bicycle facility types was below the volume observed from 2014 to 2016. Dedicated bicycle lanes experienced the most significant decline in ridership over the last three years, with protected bicycle lanes dropping by 45 percent while buffered and conventional fell by 36 percent.
Table 1
| County | Facility | # of Count Locations | AADB (‘14-’16) | AADB (‘17-’19) | AADB. (‘20-’22) | % Change (‘14-’16 to ‘17-’19) | % Change (‘17-’19 to ‘20-’22) | |
| Philadelphia | Multi-use Trail | 1 | 61 | 41 | 34 | -33% | -17% | |
| Dedicated Lane | Protected | 4 | 2100 | 2745 | 1522 | 31% | -45% | |
| Buffered | 4 | 3240 | 4307 | 2752 | 33% | -36% | ||
| Conventional | 16 | 5957 | 6241 | 3987 | 5% | -36% | ||
| Striped Shoulder | 1 | 470 | 246 | 317 | -48% | 29% | ||
| Sharrow | 2 | 680 | 199 | 254 | -71% | 28% | ||
| Mixed Traffic | 7 | 2243 | 2039 | 1373 | -9% | -33% | ||
| Overall | 35 | 14751 | 15818 | 10239 | 7% | -35% | ||
| Source: DVRPC, 2014-2022 | ||||||||
Conclusion:
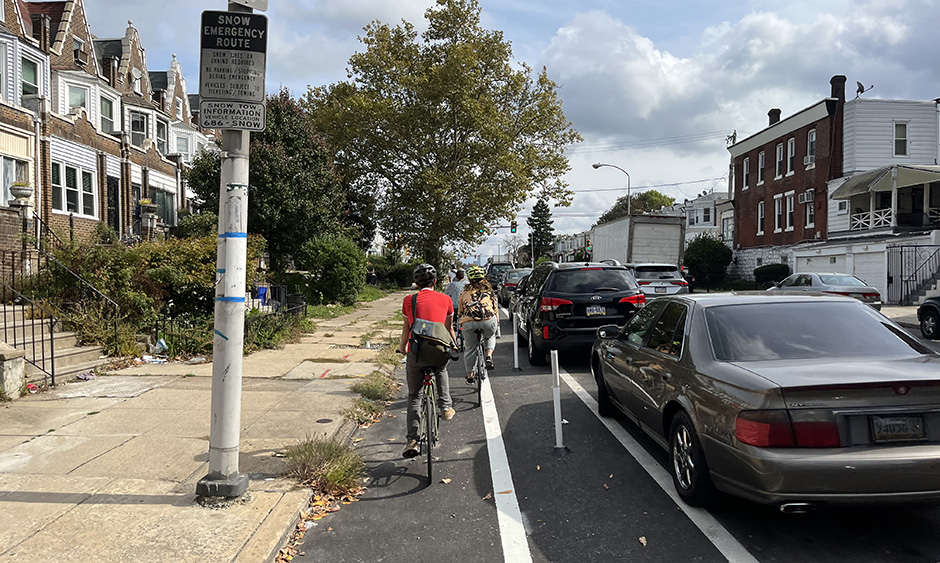
Since the beginning of DVRPC’s Bicycle Cyclical Count program in 2014, bicycle infrastructure in Philadelphia has expanded to more city streets. Notable improvements on the City’s bicycle network include the bollard and parking-protected bicycle lane on Chestnut Street between 63rd Street to 34th Street in West Philadelphia, the two-way bollard and parking-protected cycle track on 11th Street from Reed Street to Bainbridge Street in South Philadelphia, and the bollard protected bicycle lane on 22nd Street from Washington Avenue to Market Street in Center City.
Indego, Philadelphia’s public bicycle share program, launched in 2015 with 600 bicycles at 60 stations3. The initial service area focused on Center City and nearby neighborhoods but has since expanded throughout the City. In 2015, 429,710 trips were completed on Indego; seven years later, in 2022, the number of completed trips more than doubled to 905,7904. Indego now has 200 stations with over 2,000 bicycles, consisting of conventional and electric bicycles, which were introduced in 2019. Indego plans to expand its network to 3,500 bicycles at 350 stations by the end of 20265.
Even with infrastructure improvements, public initiatives, and policy changes from the City of Philadelphia, the COVID-19 pandemic has profoundly impacted the number of people riding bicycles, wiping out years of growth. Overall, cycling in the City grew by seven percent before the pandemic but decreased by 35 percent in the years since. The trend is evidenced by the decreased number of cyclists in almost every neighborhood and the reduced use of nearly every bicycle facility type, especially those heavily used before the pandemic. Outside of Philadelphia, this downward trend has been observed in peer cities. For example, in Portland, OR, bicycle ridership was also down 35 percent in 2022 compared to 2019 and decreased across every district in the City.
The decrease in cycling may partly be due to a rise in dangerous driving behavior by motorists. In 2021, eight cyclists died in Philadelphia, with seven killed by motorists, the highest number since data tracking began in 1997. In 2022, the number of cyclist fatalities fell to two in the City, but in the first couple of months of 2023, that number rose sharply, with four cyclists killed between January and March6. One trend in Philadelphia is that cyclist deaths are rising in the City even as fewer residents ride bicycles. Nationwide, there was an eight percent increase in cyclist fatalities between 2021 to 20227. Traffic calming measures and multimodal infrastructure investments could create a safer environment for all road users.
Bicycle volumes in Philadelphia have been significantly impacted by a change in commuting behavior as many office workers shifted to remote and hybrid work schedules during the COVID-19 pandemic. Nationwide, between 2019 to 2021, there was a significant decline in workers cycling to work, dropping by 24 percent8. In addition, the lingering impact of the pandemic can be observed in other modes of transportation; in April of 2023, SEPTA’s systemwide ridership was only 53 percent of its pre-pandemic levels, with its regional rail ridership at 54 percent and transit ridership at 53 percent9. Finally, the increase in working from home has led to a reduced occupancy rate in office buildings in Philadelphia. Per Kastle Systems, a security service firm that tracks entries into office buildings, the Delaware Valley’s occupancy rate is 48.9 percent, behind the national average of 57.7 percent10.
1Correction factor to account for weather conditions, seasonal and weekday variations
2Correction factor to account for weather conditions, seasonal and weekday variations
3City of Portland - 2022 Bicycle Counts Report
4United States Department of Transportation - National Highway Traffic Safety Administration
5United States Department of Transportation - Bureau of Transportation Statistics
6Kastle Systems - Weekly Occupancy Report from Kastle Access Control System Data
7United States Department of Transportation - National Highway Traffic Safety Administration
8United States Department of Transportation - Bureau of Transportation Statistics
9SEPTA - April 2023 Passenger Revenue & Ridership
10Kastle Systems - Weekly Occupancy Report from Kastle Access Control System Data