April 12, 2021
In November 2020, DVRPC and the Philadelphia’s Office of Transportation, Infrastructure, and Sustainability (oTIS) and the Streets Department completed the installation of in-street permanent bicycle counters on Spruce and Pine streets. Located near where the streets intersect 12th Street, these permanent counters fill critical data gaps that arose when planners relied on the week-long counts conducted every few years. The counters run 24/7, 365 days a year, allowing for long-term and consistent data collection and analysis.
Previous reporting has shown increases in bicycling on regional trails in the time of COVID, but new count data from these permanent counters suggests a similar finding on bicycle lanes in Center City Philadelphia.
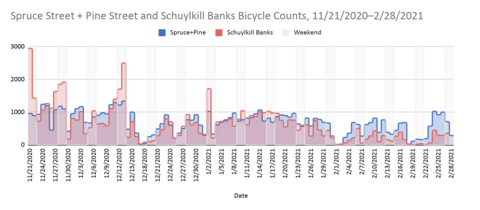
The graph above shows total cyclists using the Schuylkill Banks portion of the Schuylkill River Trail (SRT) in red, and the total cyclists using the Spruce and Pine street bicycle lanes in blue from late November to the end of February. SRT trail volumes and peaks were higher from November to late January, at which point Spruce and Pine Street volumes overtook the SRT.
On February 15th, the SRT closed at Chestnut Street for three months of construction, which may have reduced trail use near the permanent counter. The counter is located one block south of Chestnut Street. However, it is clear that before this date, trail volumes were lower when compared to Spruce and Pine streets. This could be explained by the seasonality of recreational riders on the SRT versus the consistency of bicycle commuters and utilitarian riders using the Center City bike lanes.
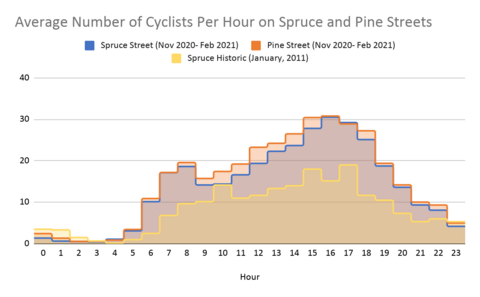
To analyze bicycle commute trends during COVID, hourly data was analyzed for Spruce and Pine streets. The graph below shows the average number of cyclists per hour passing by the permanent bicycle counters from November 2020 to February 2021. Historic data from 2011 Spruce Street counts was also averaged to provide context and comparison (data for Pine Street from this time period is not available). A limitation of the week-long counts versus the permanent counts is that the Spruce Street historic data shown here only represents average cyclists for a one-week period, while the Spruce and Pine data represents averages over a three-month period. When compared to 2011 data, bike lane usage peaked earlier in the day in 2020-2021.
Permanent bicycle counters allow planners and policymakers to better understand how various factors influence cycling. The 24/7/365 nature of the counters also allows greater certainty of how many people are actually using a facility. The counters have provided valuable data regarding commuting during COVID, and the data they produce can inform policy and plans to strengthen the region’s recovery after the pandemic. For instance, hourly data could inform a plan of targeted enforcement of “no parking in the bike lane” rules to the hours when the bike lanes are used the most.