December 21, 2020
To say it’s been an eventful year is an understatement! And we can see these ups and downs translate into different patterns of pedestrian activity across the city and are reflected in our ongoing travel monitoring efforts with our partners.
The bar chart below shows pedestrian counts from March 1st to November 30th, 2020, at 3rd and Market street (in red) and 40th and Lancaster streets (in blue). Important dates and events are highlighted as they help explain some of the peaks and valleys in the chart. In Old City, the highest number of pedestrians (5,810) was counted on November 7th, the day the election was called. People were celebrating the democratic process in the very birthplace of our democracy! Levels of walking at 40th and Lancaster stayed surprisingly consistent throughout the year, which is probably reflective of the fact that it's a hub of neighborhood activity and access to transit. It is less impacted by changes in tourism and restaurant and nightlife activity, compared to Old City.
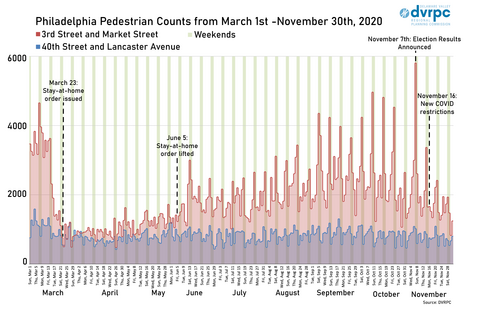
The counter at 3rd and Market is owned by Old City District. The counter at 40th and Lancaster is owned by the Philadelphia Health Department. Both agencies allow DVRPC access to their data for monitoring and analysis. Thanks to both for their sharing and collaboration!